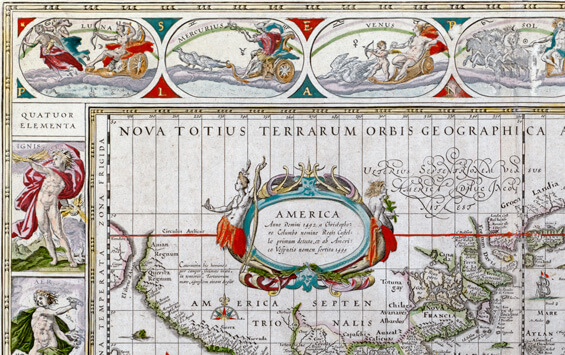
Photo: Detail of The Nova Totius Terrarum Orbis Geographica ac Hydrographica Tabula map by Willem Blaeu. Credit: Boston Public Library
You’re interested in the artistic side of maps? If you are, don’t miss the exhibition Marginalia in cARTography at the Chazen Museum of Art, the University of Wisconsin-Madison (February 28 – May 18, 2014.), or read the fascinating exhibition catalog (pdf)!
Interestingly, Marginalia in cARTography is focusing on a very particular aspect of the art present in maps. It examines the images displayed in the margins of those maps, and in “cartouches” (insets used for titles, scales, etc.). The exhibition has gathered around 50 maps from across the country, dating from the 13th century through the 1960s, and is guest curated by Sandra Sáenz-López Pérez, an art historian who has extensively researched the iconography of medieval and renaissance maps.
The word “marginalia” started to be used in the early 19th century to refer to notes, scribbles, and doodles that readers have added to the margins of books and manuscripts since antiquity.
The exhibition catalog takes us throughout history and explains in great detail the meanings of those “marginalia”, which tell so much about the interests and beliefs held during various time periods. Truly fascinating!
Images: Courtesy of the Boston Public Library.
From the middle ages to current times, marginalia have included planets, Gods, figurative representations of continents and seasons, and realistic representations of cities, the people living in different continents, and much more. They are crucial to the understanding of each map’s cultural and historical significance.
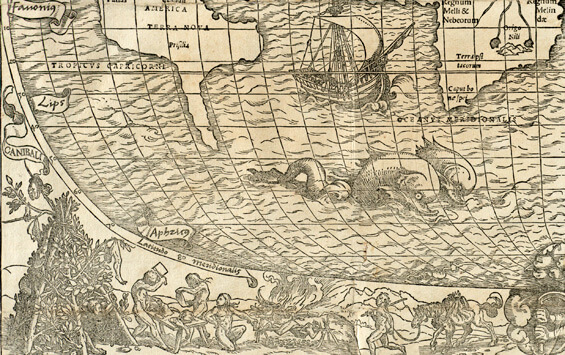
As you can read in the catalog, many medieval maps have included an image of God embracing the world. A number of maps represented the 4 continents in their margins. For instance, Sebastian Münster (1488–1552)’s mappamundi represented Africa by an elephant, snakes, and two lip-plated Africans, Asia by Indian spice plants (clove, musk, and pepper) traded through Calicut, and some natives carrying bow and arrow and dressed with feathers ( an American Indian stereotype, which proves there was confusion between the two Indies), Europe by classical architecture and European figures, and America by a cannibalism scene (see map detail below).
Theatrum Orbis Terrarum by Abraham Ortelius (1527–1598), first published in Antwerp in 1570, also represents on its frontispiece the 4 continents, this time as an allegory (4 women): Europe seating on vine leaves and clusters of grapes (symbols of the Christian Eucharist) and wearing an Imperial crown (symbol of superiority over the other continents), America holding one’s head (cannibalism), Asia as a woman with jewels, and Africa as a barely dressed black woman (with curly hair and a flat nose). The Strait of Magellan is represented by a woman’s bust, decorated with flames that Magellan saw and that gave the name to this land (Tierra del Fuego).
After Theatrum Orbis Terrarum, allegories of the four continents have been frequently used as artistic motifs in maps of that period. In those, Europe is often represented as superior to the other 3 continents. Allegories of seasons, the 4 elements, or planets (see map detail below) are also illustrated in the margins of maps. Indeed, marginalia in maps contributed to spread the knowledge of major advances in astronomy of the time (Copernicus, 1473 – 1543).
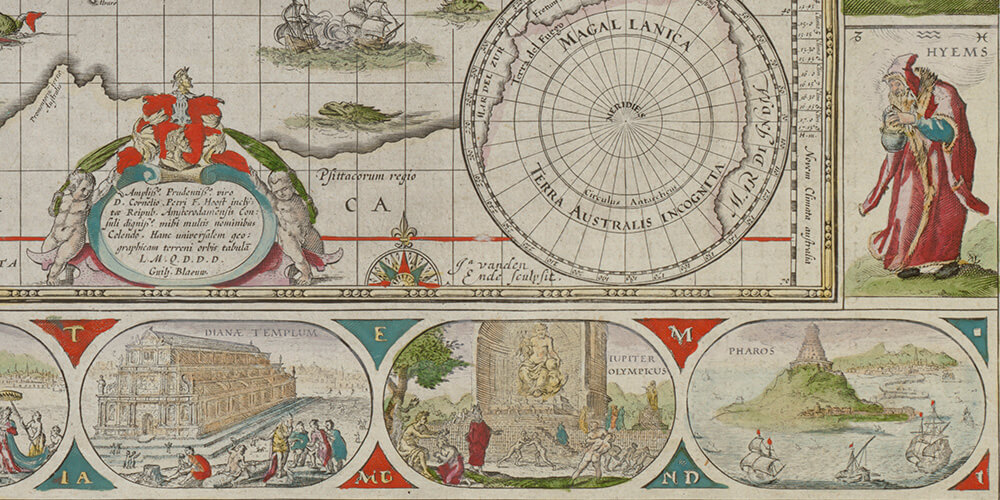
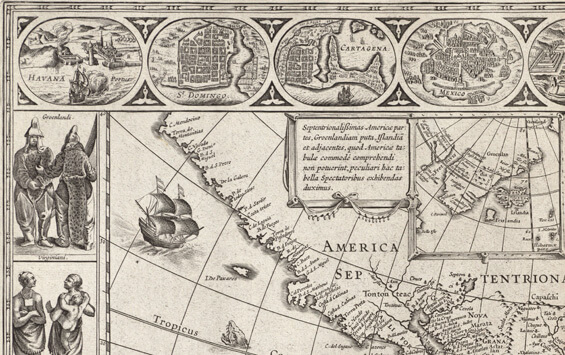
As an example, Willem Janszoon Blaeu (1571–1638) The Nova Totius Terrarum Orbis Geographica ac Hydrographica Tabula map, originally published in Amsterdam in 1606 shows the 4 elements (fire, air, water, and earth), the four seasons, seven planets personified by the gods of the Greco-Roman pantheon (Moon, Mercury, Venus, Sol, Mars, Jupiter, and Saturn) and the Seven Wonders of the Ancient World (the Hanging Gardens of Babylon, the Colossus over the harbor at Rhodes, the Egyptian pyramids, the Mausoleum of Halicarnassus at Caria, the Temple of Artemis (or Diana) at Ephesus, the Statue of Zeus at Olympia, and the lighthouse of Alexandria) in its illustrated borders. His Americae Nova Tabula map shows cities of the world and the people from various parts of this continent (see map detail below).
On Joan Blaeu’s Nova et accuratissima totius terrarum orbis tabula map, seasons are represented as figures: Spring as a young woman holding flowers, Summer as a nude woman with a sheaf of wheat, Autumn, a Bacchic figure holding a cluster of grapes and a cup, and Winter as a shivering old man with a hat, wrapped in a blanket, and huddled by the fire. “The inclusion of the four seasons links time to space (the map), and the temporal dimension of the earth’s annual orbit around the sun and the movement of the planets come into play” explains the exhibition catalog. This clearly represents Copernicus’ heliocentric theory.
In the 2nd half of the 16th century, the expansion of the mapmaking industry in the Netherlands marks the golden age of decorative cartography. Artistic motifs move from allegorical representations to more documentary representations of various cultures and people. Cartographers rely on travelers’ journals to draw plans and views of cities, people with distinct physical features and clothing, busts of sovereigns, etc.
- In his first known map, published in Antwerp in 1564, the Flemish cartographer Abraham Ortelius (1527–1598) included the images of the two most important American cities of that time, Cuzco and Tenochtitlan.
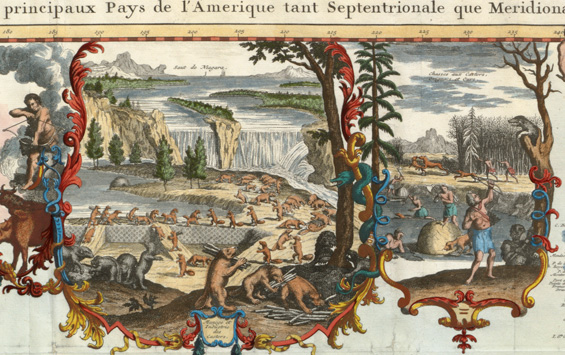
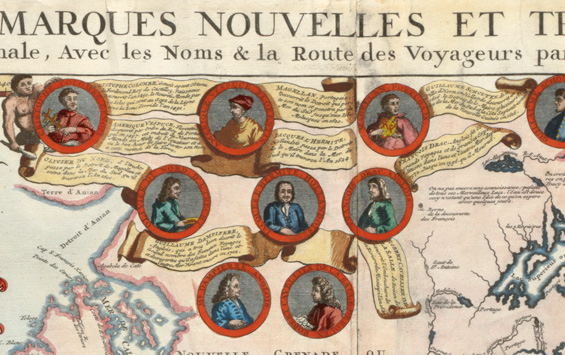
- Châtelain’s world map, first published in 1719 the Atlas Historique ou Nouvelle Introduction à l’Histoire à la Chronologie et à la Géographe Ancienne et Moderne, has more than 35 insets and cartouches. They include the portraits of 9 famous explorers (see map detail below): Columbus, Vespucci, Magellan, Schouten, Van Noort, L’Hermite, Drake, Dampier, and La Salle (the tracks of their voyages are marked on the map); maps of significant locations, such as the Gibraltar Strait, the Rio de la Plata, Niagara Falls (see map detail below), and the Cape of Good Hope; narrative scenes, such as the arrival of Cortés in Mexico; the colonial economies in America based on codfish-processing factories in Greenland, hunting of beaver, moose, and bear, gold and silver mines (such as in Potosí) and sugar mills and cassava growing in South America; exotic plants (a pineapple, bananas, potatoes) and animals (llamas, a penguin, turtles, various birds, an opossum).
As the catalog explains, later in history, cartography will play an important role “in the formation of modern states, as a way of controlling the territory, as a strategic tool for war, and as a symbolic element to boast the power of a nation.“
Finally, the catalog discusses another element of art in cartography, the cartouche, a panel with a decorative frame, used in maps from the 16th to the 19th centuries. Sometimes very elaborate, cartouches were an Italian creation, explains the catalog. They were imitating leather or wood borders or were decorated with Italian decorative elements, figures (Natives, Africans, American slaves, etc.), images of locations, e.g. Niagara Falls in Nicolas de Fer’s map (1698), etc.
-
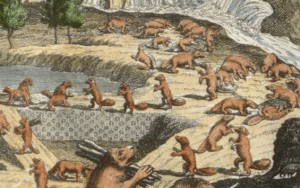
Chatelain’s map – beavers -
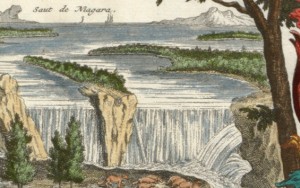
Chatelain’s map – Niagara Falls -
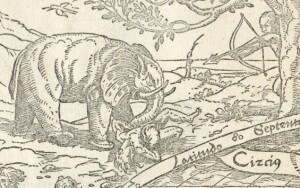
Sebastian Munster’s map – Asia -
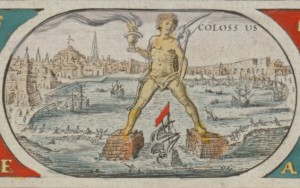
Willem Blaeu’s map – Rhodes Colossus -
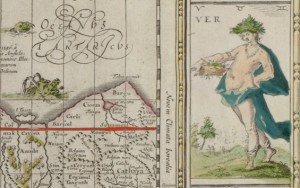
Willem Blaeu’s map – Spring -
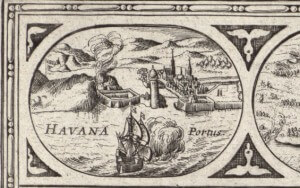
Willem Blaeu’s map – Havana
For more information on the exhibit:
Marginalia in cARTography
Chazen Museum of Art
Leslie and Johanna Garfield Gallery
750 University Ave., Madison, WI
Dates: February 28 to May 18, 2014
Opening hours:
Tuesday-Wednesday-Friday: 9 am – 5 pm
Thursday: 9 am – 9 pm
Saturday-Sunday: 11am – 5pm
Closed on Monday
Website: Marginalia in cARTography, Chazen Museum of Art
Further reading:
- The exhibition catalog Marginalia in CARTography by Sandra Sáenz-López Pérez under the Catalogues section)
- The news article: New show of historical maps at the Chazen zooms in on the margins including an interview of the editor of Chazen Museum of Art, Kirstin Pires